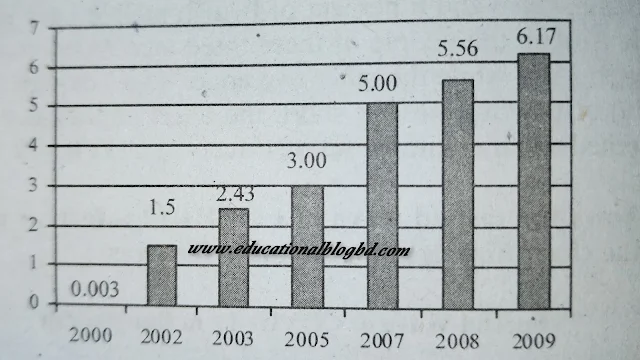
'The Internet Users' Graph and Chart from 2002 to 2009 for HSC Exam
Assalamualaikum everyone, I hope everyone is well by Allah grace. Today I will discuss very very important graph and chart for the hsc student. This graph name is the internet users from 2000 to 2009.
Q:The graph below shows 'The Internet Users' from 2000 to 2009. The number is mentioned in lakh. Describe the graph in at least 80 words. You should highlight the information and report the main features given in the graph.
 |
| The Internet Users |
Ans. The graph presents a comparative study of the number of internet users from the year 2000 to 2009. According to the graph, the number of internet users kept rising rapidly during the mentioned years. In 2000, the number of internet users was only 0.003 lakh. Within two years, this number rose to 1.5 lakh. The following year, it went up to 2.43. The remarkable increase is noticed between 2005 and 2007. In 2007, the number of internet users rose to 5 lakh, which was 3 lakh in 2005. This increase continued in the next years. In 2008, it became 5.56 lakh, and ultimately, it went up to 6.17 lakh in 2009. From the analysis of the graph, it is clear that the number of internet users is increasing keeping pace with the demand of the modern age.
