Literacy rate of Bangladesh graph and chart
Assalamualaikum everyone, I hope everyone is well by Allah grace. Today I will discuss very very important graph and chart for the hsc student. This graph name is Literacy rate of Bangladesh. So let's get start.
Q:The graph below shows the literacy rate of Bangladesh from 1995 to 2010. Describe the graph in 150 words. You should highlight and summarize the information given in the graph.
 |
| Literacy rate of Bangladesh |
Literacy Rate of Bangladesh from 1995-2010
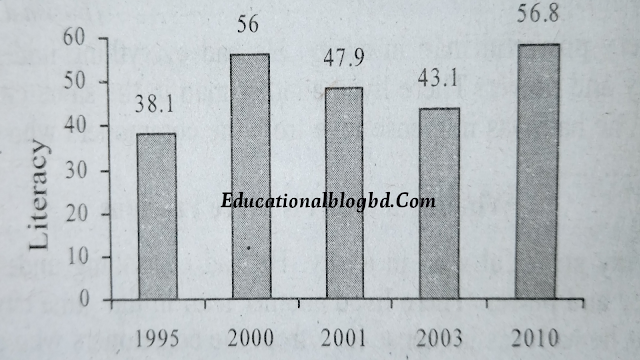
Ans. The graph deals/narrates with the literacy rate of Bangladesh. It shows the trend in literacy rate that took place within the time span of 1995 to 2010. In the year 1995, only 38.1 percent people of Bangladesh were literate. The rate took a good leap to 56 percent in 2000, within the period of 5 years. Unfortunately, in 2001, the number of literacy rate decreased to 47.9 percent. In 2003, the trend of decrease went on, and as a result, the literacy rate went down to 43.1 percent. In 2010, with a happy note, the literacy rate went up to 56.8 percent. It was the result of hard work of the previous seven years. So, it can be said that within the period of 15 years, there is a great achievement in education sector. In this period of time, the literacy rate has increased to a great extent.
Q: The graph below shows the literacy rate of Bangladesh from 1995 to 2010. Describe the graph in 150 words. You should highlight and summarize the information given in the graph.
 |
| Literacy rate of Bangladesh |
Literacy Rate of Bangladesh from 1995-2010
Answer: The graph provides the information about the literacy rate in Bangladesh from the year 1995 to 2010. The horizontal line indicates the different years and the vertical line indicates the percentage of literacy rate. In the graph, we can see remarkable increase almost all' the way through without an exception in 2001 and in 2003. In 1995 the literacy rate was 38.1% only. It got a tremendous rise during the next five years and reached at 56%. But in the next year in 2001 there was a slight fall and it became 47.9%. In 2003, there was a similar trend of falling in literacy. This year it lessened and became 43.1%. But the year 2010 experienced a sharp rise in the literacy rate. In this year the rate is 56.8%. The overall chart shows an increasing trend except two years. It presents us an optimistic trend of our literacy rate.
OR,
: The graph below shows the literacy rate of Bangladesh from 1995 to 2010. Describe the graph in 150 words. You should highlight and summarize the information given in the graph
 |
| Literacy Rate of Bangladesh |
Literacy Rate of Bangladesh from 1995-2010
The graph gives an idea about the literacy rate of Bangladesh over the years between 1995 and 2010. The graph shows an irregular rate of increase and decrease in some years from 1995 till 2010. In 1995, the rate was 38.1% which is the lowest of all. However, in the next five years there is a significant growth of literacy, and from the graph we find that in 2000, the literacy rate becomes 56%. So, within five years time there is (56-38.1-) 17.9% growth in literacy. However, the rate goes downward after 2000. Thus we find that in 2001 the rate comes down to 47.9% from its previous year-rate, 56%. There is still a downward trend in the next two years. The graph shows that in the year 2003 the rate falls from 47.9 to 43.1. This means that within two years there is a decrease of (47.9-43.1=) 4.8% literacy rate. However, from the next year, that is from 2004, the rate of literacy goes upward. Within a span of seven years this rate becomes 56.8%. It means that within a period of seven years there is (56.8-43.1) 13.7% increase of literacy rate. The overall analysis of the graph shows that the highest rate of literacy between 1995 and 2010 is 56.8% and the lowest is 38.1%. Though there is a decreasing trend between the years 2001 and 2003, the overall trend is on the increase. Thus, it is found that within a span of sixteen years the literacy rate increases from 38.1 to 56.8, which is a very significant growth. Thus the graph gives a good idea and the trend of literacy rate of Bangladesh from 1995 till 2010.
অনুবাদ : লেখচিত্রটি থেকে ১৯৯৫ এবং ২০১০ এর মধ্যবর্তী বছরসমূহে বাংলাদেশের সাক্ষরতার হার সম্পর্কে ধারণা পাওয়া যায়। লেখচিত্রে ১৯৯৫ থেকে ২০১০ এর কয়েকটি বছরে সাক্ষরতার হারের অনিয়মিত হ্রাস-বৃদ্ধি প্রদর্শিত হয়েছে। ১৯৯৫ সালে এই হার ছিল ৩৮১%, যা সর্বনিম্ন। যা-ই হোক, পরবর্তী পাঁচ বছরে তাৎপর্যপূর্ণ সাক্ষরতা বৃদ্ধি রয়েছে এবং লেখচিত্র থেকে আমরা দেখি যে, ২০০০ সালে সাক্ষরতার হার-৫৬% এ পরিণত হয়েছে। তাই, পাঁচ বছর সময়ের মধ্যে সাক্ষরতার বৃদ্ধি হয়েছে (৫৬-৩৮.১=) ১৭.৯%। যা-ই হোক, ২০০০ সালের পরে এ হার নিম্নগামী হয়েছে। এভাবে আমরা দেখি যে, পূর্ববর্তী বছরের হার ৫৬% থেকে ২০০১ এ হ্রাস পেয়ে হার ৪৭.৯% হয়েছে। পরবর্তী দুই বছরেও নিম্নমুখী প্রবণতা রয়েছে। লেখচিত্রে প্রদর্শিত হয়েছে যে, ২০০৩ সালে হার হ্রাস পেয়ে ৪৭.৯ থেকে ৪৩.১ হয়েছে। এর মানে এই যে, দুই বছরের মধ্যে সাক্ষরতার হার হ্রাস পেয়েছে (৪৭.৯-৪৩.১=) ৪.৮%। যা-ই হোক, পরবর্তী বছর থেকে, অর্থাৎ ২০০৪ থেকে, সাক্ষরতার হার ঊর্ধ্বগামী হয়েছে। সাত বছর সময়ের মধ্যে এই হার ৫৬.৮% এ পরিণত হয়েছে। এর অর্থ হলো যে সাত বছর সময়ের মধ্যে সাক্ষরতার হার বৃদ্ধি হয়েছে (৫৬.৮-৪৩.১=) ১৩.৭%। লেখচিত্রটির সার্বিক পর্যালোচনা প্রদর্শন করে যে, ১৯৯৫ থেকে ২০১০ এর মধ্যে সর্বোচ্চ সাক্ষরতার হার হলো ৫৬.৮% এবং সর্বনিম্ন ৩৮.১%। ২০০১ ও ২০০৩ সালের মাঝামাঝিতে নিম্নগামী প্রবণতা থাকলেও সার্বিক প্রবণতা ঊর্ধ্বগামী। এভাবে দেখা যায় যে, ষোল বছর সময়ের মধ্যে সাক্ষরতার হার ৩৮.১ থেকে বৃদ্ধি পেয়ে ৫৬.৮ হয়েছে, যা অত্যন্ত তাৎপর্যপূর্ণ উন্নতি। এভাবে লেখচিত্রটি থেকে ১৯৯৫ থেকে ২০১০ পর্যন্ত বাংলাদেশের সাক্ষরতার হার সম্পর্কে চমৎকার ধারণা পাওয়া যায়।

